The Five-Thirty Eight blog provides a brand new definition of the p-value:
http://fivethirtyeight.com/datalab/psychology-is-starting-to-deal-with-its-replication-problem/?ex_cid=538twitter
"A p-value is simply the probability of getting a result at least as extreme as the one you saw if your hypothesis is false."
I thought this blog was run by Nate Silver, a statistician?
Thursday, August 27, 2015
Observed vs True Statistical Power, and the power inflation index
People (including me) routinely estimate statistical power for future studies using a pilot study's data or a previously published study's data (or perhaps using the predictions from a computational model, such as Engelmann et al 2015).
Indeed, the author of the Replicability Index has been using observed power to determine the replicability of journal articles. His observed power estimates are HUGE (in the range of 0.75) and seem totally implausible to me, given the fact that I can hardly ever replicate my studies.
This got me thinking: Gelman and Carlin have shown that when power is low, Type M error will be high. That is, the observed effects will tend to be highly exaggerated. The issue with Type M error is easy to visualize.
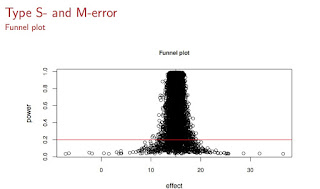
Suppose that a particular study has standard error 46, and sample size 37; this implies that standard deviation is $46\times \sqrt{37}= 279$. These are representative numbers from psycholinguistic studies. Suppose also that we know that the true effect (the absolute value, say on the millisecond scale for a reading study---thanks to Fred Hasselman) is D=15. Then, we can compute Type S and Type M errors for replications of this particular study by repeatedly sampling from the true distribution.
We can visualize the exaggerated effects under low power as follows (see below): On the x-axis you see the effect magnitudes, and on the y-axis is power. The red line is the power line of 0.20, which based on my own attempts at replicating my own studies (and mostly failing), I estimate to be an upper bound of the power of experiments in psycholinguistics (this is an upper bound, I think a more common value will be closer to 0.05). All those dots below the red line are exaggerated estimates in a low power situation, and if you were to use any of those points to estimate observed power, you would get a wildly optimistic power estimate which has no bearing with reality.
What does this fact about Type M error imply for Replicability Index's calculations? It implies that if power is in fact very low, and if journals are publishing larger-than-true effect sizes (and we know that they have an incentive to do so, because editors and reviewers mistakenly think that lower p-values, i.e., bigger absolute t-values, give stronger evidence for the specific alternative hypothesis of interest), then Replicability Index is possibly hugely overestimating power, and therefore hugely overestimating replicability of results.
I came up with the idea of framing this overestimation in terms of Type M error by defining something called a power inflation index. Here is how it works. For different "true" power levels, we repeatedly sample data, and compute observed power each time. Then, for each "true" power level, we can compute the ratio of the observed power to the true power in each case. The mean of this ratio is the power inflation index, and the 95% confidence interval around it gives us an indication (sorry Richard Morey! I know I am abusing the meaning of CI here and treating it like a credible interval!) of how badly we could overestimate power from a small sample study.
Here is the code for simulating and visualizing the power inflation index:
And here is the visualization:
 What we see here is that if true power is as low as 0.05 (and we can never know that it is not since we never know the true effect size!), then using observed power can lead to gross overestimates by a factor of approximately 10! So, if Replicability Index reports an observed power of 0.75, what he might actually be looking at is an inflated estimate where true power is 0.08.
In summary, we can never know true power, and if we are estimating it using observed power conditional on true power being extremely low, we are likely to hugely overestimate power.
One way to test my claim is to actually try to replicate the studies that Replicability Index predicts has high replicability. My prediction is that his estimates will be wild overestimates and most studies will not replicate.
Postscript
A further thing that worries me about Replicability Index is his sloppy definitions of statistical terms. Here is how he defines power:
"Power is defined as the long-run probability of obtaining significant results in a series of exact replication studies. For example, 50% power means that a set of 100 studies is expected to produce 50 significant results and 50 non-significant results."
[Thanks to Karthik Durvasula for correcting my statement below!]
By not defining power of a test of a null hypothesis $H_0: \mu=k$, as the probability of rejecting the null hypothesis (as a function of different alternative $\mu$ such that $\mu\neq k$) when it is false, what this definition literally means is that if I sample from any distribution, including one where $\mu=0$, the probability of obtaining a significant result under repeated sampling is the power. Which of course is completely false.
Post-Post Script
Replicability Index points out in a tweet that his post-hoc power estimation corrects for inflation. But post-hoc power corrected for inflation requires knowledge of the true power, which is what we are trying to get at in the first place. How do you deflate "observed" power when you don't know what the true power is? Maybe I am missing something.
Indeed, the author of the Replicability Index has been using observed power to determine the replicability of journal articles. His observed power estimates are HUGE (in the range of 0.75) and seem totally implausible to me, given the fact that I can hardly ever replicate my studies.
This got me thinking: Gelman and Carlin have shown that when power is low, Type M error will be high. That is, the observed effects will tend to be highly exaggerated. The issue with Type M error is easy to visualize.
Suppose that a particular study has standard error 46, and sample size 37; this implies that standard deviation is $46\times \sqrt{37}= 279$. These are representative numbers from psycholinguistic studies. Suppose also that we know that the true effect (the absolute value, say on the millisecond scale for a reading study---thanks to Fred Hasselman) is D=15. Then, we can compute Type S and Type M errors for replications of this particular study by repeatedly sampling from the true distribution.
We can visualize the exaggerated effects under low power as follows (see below): On the x-axis you see the effect magnitudes, and on the y-axis is power. The red line is the power line of 0.20, which based on my own attempts at replicating my own studies (and mostly failing), I estimate to be an upper bound of the power of experiments in psycholinguistics (this is an upper bound, I think a more common value will be closer to 0.05). All those dots below the red line are exaggerated estimates in a low power situation, and if you were to use any of those points to estimate observed power, you would get a wildly optimistic power estimate which has no bearing with reality.
What does this fact about Type M error imply for Replicability Index's calculations? It implies that if power is in fact very low, and if journals are publishing larger-than-true effect sizes (and we know that they have an incentive to do so, because editors and reviewers mistakenly think that lower p-values, i.e., bigger absolute t-values, give stronger evidence for the specific alternative hypothesis of interest), then Replicability Index is possibly hugely overestimating power, and therefore hugely overestimating replicability of results.
I came up with the idea of framing this overestimation in terms of Type M error by defining something called a power inflation index. Here is how it works. For different "true" power levels, we repeatedly sample data, and compute observed power each time. Then, for each "true" power level, we can compute the ratio of the observed power to the true power in each case. The mean of this ratio is the power inflation index, and the 95% confidence interval around it gives us an indication (sorry Richard Morey! I know I am abusing the meaning of CI here and treating it like a credible interval!) of how badly we could overestimate power from a small sample study.
Here is the code for simulating and visualizing the power inflation index:
And here is the visualization:
In summary, we can never know true power, and if we are estimating it using observed power conditional on true power being extremely low, we are likely to hugely overestimate power.
One way to test my claim is to actually try to replicate the studies that Replicability Index predicts has high replicability. My prediction is that his estimates will be wild overestimates and most studies will not replicate.
Postscript
A further thing that worries me about Replicability Index is his sloppy definitions of statistical terms. Here is how he defines power:
"Power is defined as the long-run probability of obtaining significant results in a series of exact replication studies. For example, 50% power means that a set of 100 studies is expected to produce 50 significant results and 50 non-significant results."
[Thanks to Karthik Durvasula for correcting my statement below!]
By not defining power of a test of a null hypothesis $H_0: \mu=k$, as the probability of rejecting the null hypothesis (as a function of different alternative $\mu$ such that $\mu\neq k$) when it is false, what this definition literally means is that if I sample from any distribution, including one where $\mu=0$, the probability of obtaining a significant result under repeated sampling is the power. Which of course is completely false.
Post-Post Script
Replicability Index points out in a tweet that his post-hoc power estimation corrects for inflation. But post-hoc power corrected for inflation requires knowledge of the true power, which is what we are trying to get at in the first place. How do you deflate "observed" power when you don't know what the true power is? Maybe I am missing something.
Subscribe to:
Posts (Atom)