Recently, Barr et al published a paper in the Journal of Memory and Language, arguing that we should fit maximal linear mixed models, i.e., fit models that have a full variance-covariance matrix specification for subject and for items. I suggest here that the recommendation should not be to fit maximal models, the recommendation should be to run high power studies.
I released a simulation on this blog some time ago arguing that the correlation parameters are pretty meaningless. Dale Barr and Jake Westfall replied to my post, raising some interesting points. I have to agree with Dale's point that we should reflect the design of the experiment in the analysis; after all, our goal is to specify how we think the data were generated. But my main point is that given the fact that the culture in psycholinguistics is to run low power studies (we routinely publish null results with low power studies and present them as positive findings), fitting maximal models without asking oneself whether the various parameters are reasonably estimable will lead us to miss effects.
For me, the only useful recommendation to psycholinguists should be to run high power studies.
Consider two cases:
1. Run a low power study (the norm in psycholinguistics) where the null hypothesis is false.
If you blindly fit a maximal model, you are going to miss detecting the effect more often compared to when you fit a minimal model (varying intercepts only). For my specific example below, the proportions of false negatives is 38% (maximal) vs 9% (minimal).
In the top figure, we see that under repeated sampling, lmer is failing to estimate the true correlations for items (it's doing a better job for subjects because there is more data for subjects). Even though these are nuisance parameters, trying to estimate them for items in this dataset is a meaningless exercise (and the fact that the parameterization is going to influence the correlations is not the key issue here---that decision is made based on the hypotheses to be tested).
The lower figure shows that under repeated sampling, the effect (\mu is positive here, see my earlier post for details) is being missed much more often with a maximal model (black lines, 95% CIs) than with a varying intercepts model (red lines). The difference is in the miss probability is 38% (maximal) vs 9% (minimal).
2. Run a high power study.
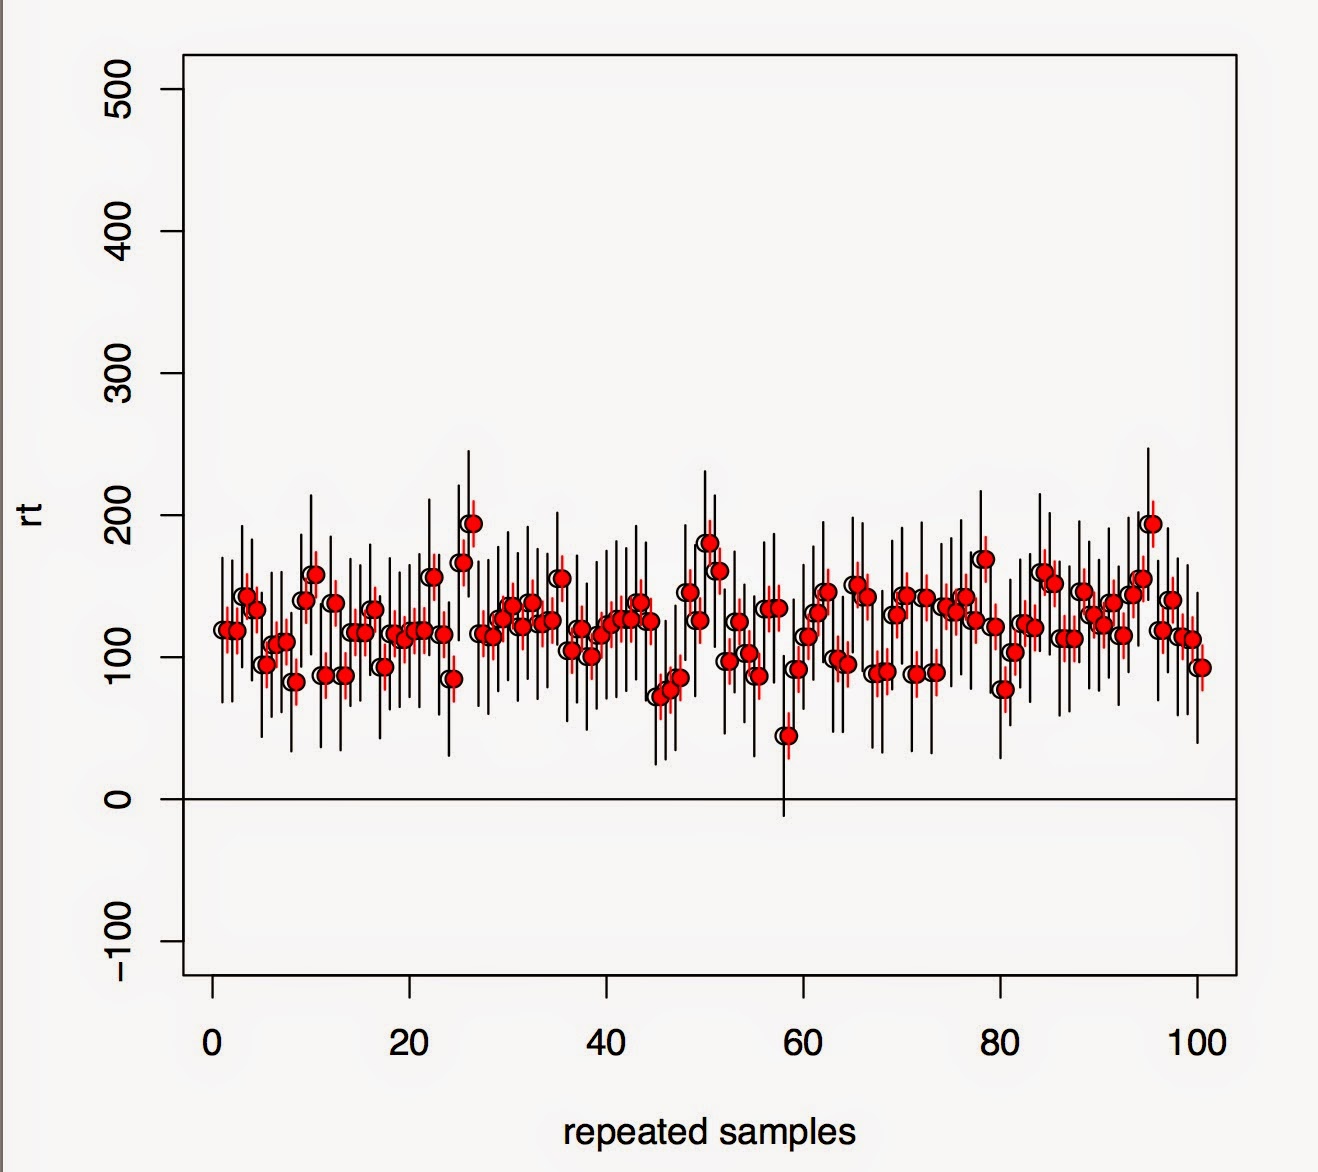
Now, it doesn't really matter whether you fit a maximal model or not. You're going to detect the effect either way. The upper plot shows that under repeated sampling, lmer will tend to detect the true correlations correctly. The lower plot shows that in almost 100% of the cases, the effect is detected regardless of whether we fit a maximal model (black lines) or not (red lines).
My conclusion is that if we want to send a message regarding best practice to psycholinguistics, it should not be to fit maximal models. It should be to run high power studies. To borrow a phrase from Andrew Gelman's blog (or from Rob Weiss's), if you are running low power studies, you are leaving money on the table.
Here's my code to back up what I'm saying here. I'm happy to be corrected!
https://gist.github.com/vasishth/42e3254c9a97cbacd490
This blog is a repository of cool things relating to statistical computing, simulation and stochastic modeling.
Search
Tuesday, November 25, 2014
Saturday, November 22, 2014
Simulating scientists doing experiments
Following a discussion on Gelman's blog, I was playing around with simulating scientists looking for significant effects. Suppose each of 1000 scientists run 200 experiments in their lifetime, and suppose that 20% of the experiments are such that the null is true. Assume a low power experiment (standard in psycholinguistics; eyetracking studies even in journals like JML can easily have something like 20 subjects). E.g., with a sample size of 1000, delta of 2, and sd of 50, we have power around 15%. We will add the stringent condition that the scientist has to get one replication of a significant effect before they publish it.
What is the proportion of scientists that will publish at least one false positive in their lifetime? That was the question. Here's my simulation. You can increase the effect_size to 10 from 2 to see what happens in high power situations.
Comments and/or corrections are welcome.
What is the proportion of scientists that will publish at least one false positive in their lifetime? That was the question. Here's my simulation. You can increase the effect_size to 10 from 2 to see what happens in high power situations.
Comments and/or corrections are welcome.
Saturday, August 23, 2014
An adverse consequence of fitting "maximal" linear mixed models
![]() |
Distribution of intercept-slope correlation estimates with 37 subjects, 15 items |
![]() |
Distribution of intercept-slope correlation estimates with 50 subjects, 30 items |
Let's create a repeated measures data-set that has two conditions (we want to keep this example simple), and the following underlying generative distribution, which is estimated from the Gibson and Wu 2012 (Language and Cognitive Processes) data-set. The dependent variable is reading time (rt).
\begin{equation}\label{eq:ranslp2}
rt_{i} = \beta_0 + u_{0j} + w_{0k} + (\beta_1 + u_{1j} + w_{1k}) \hbox{x}_i + \epsilon_i
\end{equation}
\begin{equation}
\begin{pmatrix}
u_{0j} \\
u_{1j}
\end{pmatrix}
\sim
N\left(
\begin{pmatrix}
0 \\
0
\end{pmatrix},
\Sigma_{u}
\right)
\quad
\begin{pmatrix}
w_{0k} \\
w_{1k} \\
\end{pmatrix}
\sim
N \left(
\begin{pmatrix}
0 \\
0
\end{pmatrix},
\Sigma_{w}
\right)
\end{equation}
\begin{equation}\label{eq:sigmau}
\Sigma_u =
\left[ \begin{array}{cc}
\sigma_{\mathrm{u0}}^2 & \rho_u \, \sigma_{u0} \sigma_{u1} \\
\rho_u \, \sigma_{u0} \sigma_{u1} & \sigma_{u1}^2\end{array} \right]
\end{equation}
\begin{equation}\label{eq:sigmaw}
\Sigma_w =
\left[ \begin{array}{cc}
\sigma_{\mathrm{w0}}^2 & \rho_w \, \sigma_{w0} \sigma_{w1} \\
\rho_w \, \sigma_{w0} \sigma_{w1} & \sigma_{w1}^2\end{array} \right]
\end{equation}
\begin{equation}
\epsilon_i \sim N(0,\sigma^2)
\end{equation}
One difference from the Gibson and Wu data-set is that each subject is assumed to see each instance of each item (like in the old days of ERP research), but nothing hinges on this simplification; the results presented will hold regardless of whether we do a Latin square or not (I tested this).
The parameters and sample sizes are assumed to have the following values:
* $\beta_1$=487
* $\beta_2$= 61.5
* $\sigma$=544
* $\sigma_{u0}$=160
* $\sigma_{u1}$=195
* $\sigma_{w0}$=154
* $\sigma_{w1}$=142
* $\rho_u=\rho_w$=0.6
* 37 subjects
* 15 items
Next, we generate data 100 times using the above parameter and model specification, and estimate (from lmer) the parameters each time. With the kind of sample size we have above, a maximal model does a terrible job of estimating the correlation parameters $\rho_u=\rho_w$=0.6.
However, if we generate data 100 times using 50 subjects instead of 37, and 30 items instead of 15, lmer is able to estimate the correlations reasonably well.
In both cases we fit ''maximal'' models; in the first case, it makes no sense to fit a "maximal" model because the correlation estimates tend to be over-estimated. The classical method (the generalized likelihood ratio test (the anova function in lme4) to find the ''best'' model) for determining which model is appropriate is discussed in the Pinheiro and Bates book, and would lead us to adopt a simpler model in the first case.
Douglas Bates himself has something to say on this topic:
https://stat.ethz.ch/pipermail/r-sig-mixed-models/2014q3/022509.html
As Bates puts it:
"Estimation of variance and covariance components requires a large number of groups. It is important to realize this. It is also important to realize that in most cases you are not terribly interested in precise estimates of variance components. Sometimes you are but a substantial portion of the time you are using random effects to model subject-to-subject variability, etc. and if the data don't provide sufficient subject-to-subject variability to support the model then drop down to a simpler model. "
Here is the code I used:
Subscribe to:
Posts (Atom)